Project CTree

A visual notebook of analytics prepared by Kanishka Narayan. For details contact-kanishkan91@gmail.com or visit my github

Static Visualizations

Animations

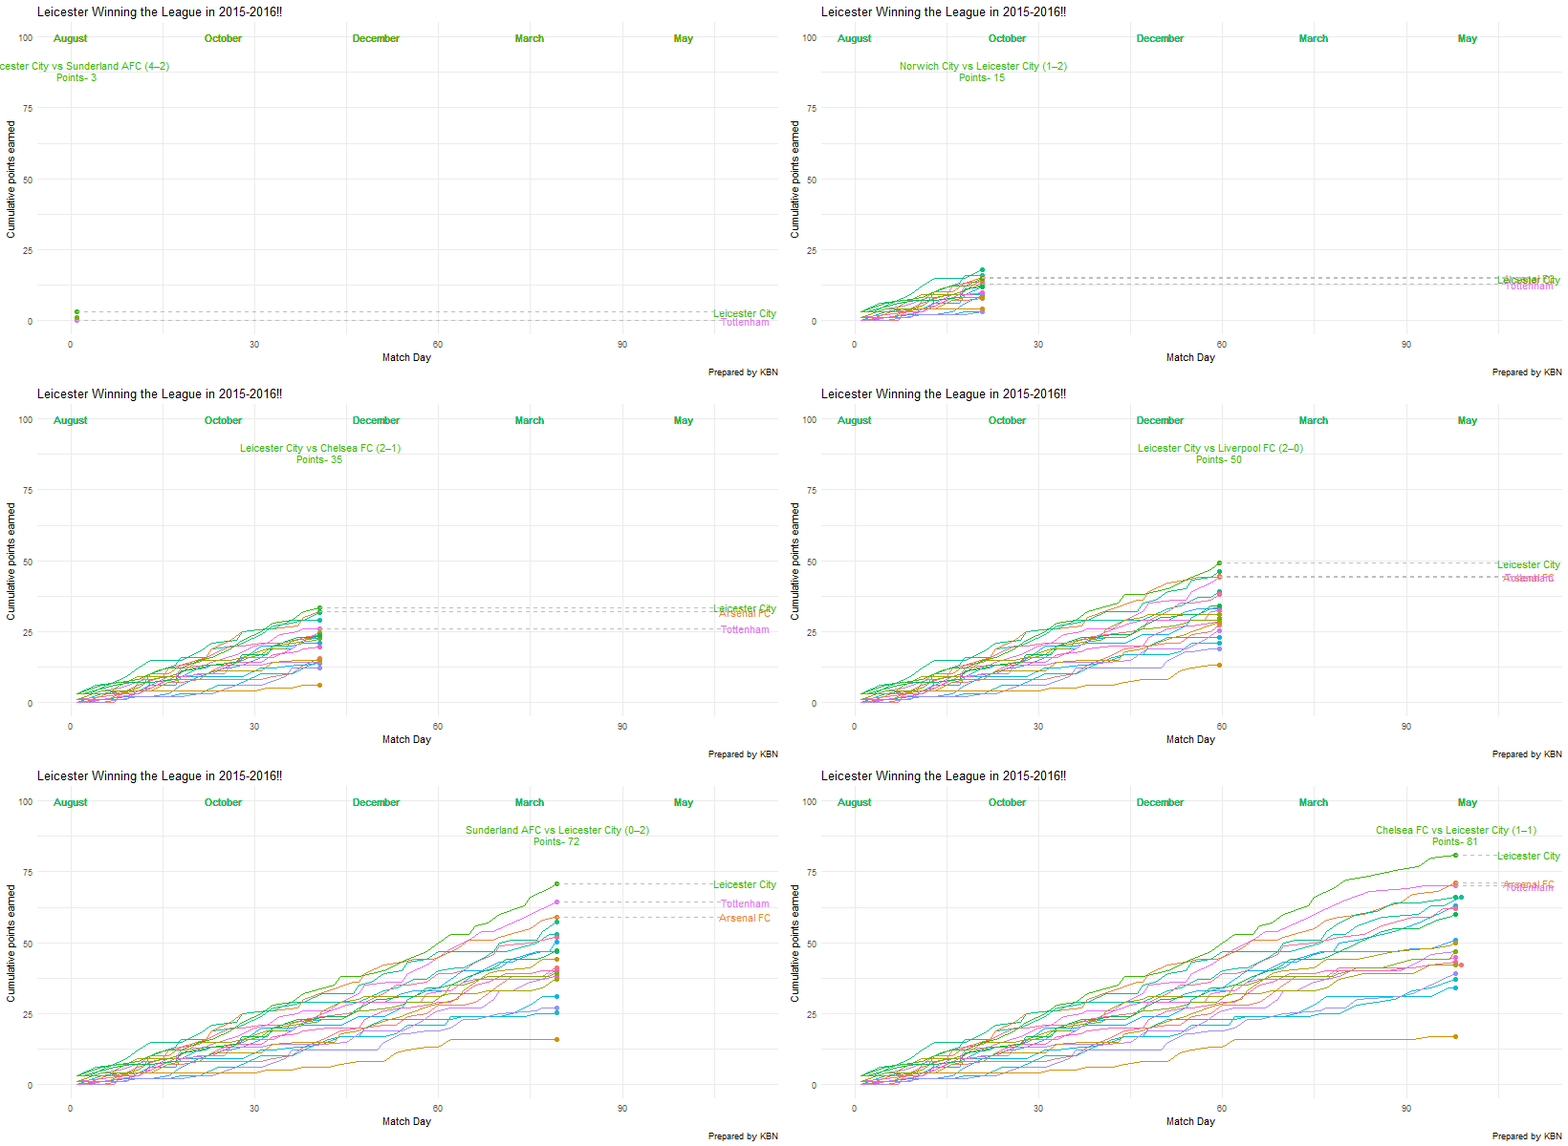
Animation showing Leicester City winning the EPL in 2015-16

Leicester

Dynamic Web applications

Example of network visualization application in R

Dynamic Visualizations & animation applications

Understanding different models of conflict through Treeplots in R (Please click on the nodes!)

Meet the Musician behind the Music

Kanishka B Narayan

Random Name

Hi, I'm Kanishka. I love Melodic Death Metal and Samurai Jack. I also like making visualizations and analytic applications. I am a Statistical Modeller and Quantitative Analyst by profession. Most of the visualizations and applications here are prepared in R, Python and Tableau. Applications are deployed on Amazon AWS (Elastic Beanstalk) and Heroku servers.